Background
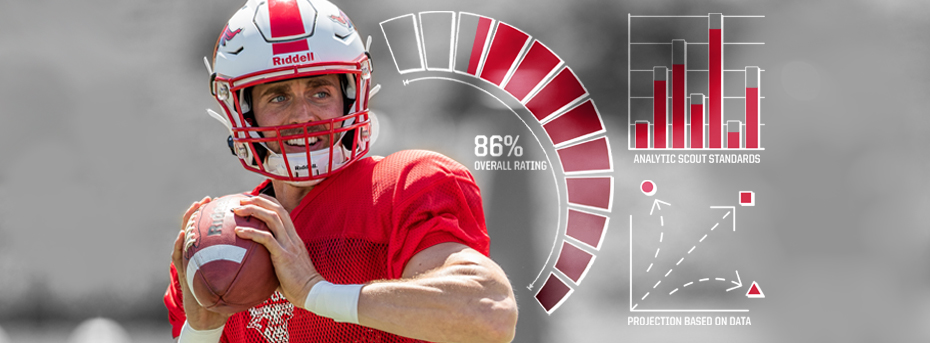
NFL draft day evaluations now go far beyond the typical Combine results. People are familiar with the skill measurements used to grade a player’s abilities – 40-yard dash, bench press, vertical jump, etc. – but thanks to the analytics movement, teams have access to much more information.
Because of this, teams like the Eagles and Ravens employ devoted analytics departments to take advantage of this information and decipher where talent is being undervalued.
One thing to note before we dive in is that analytics are different in football than in other sports because of sample size. In sports like basketball and baseball, analytic models are built off an enormous database of repeated one-on-one interactions (like how many swings and misses a pitcher generates with a slider), but in football, there are so many moving pieces on any given play that it is difficult to utilize a similar system. Because of this, analytics in football focus more on player tracking via GPS and how that data relates to performance in specific schemes or personnel packages.
How this relates to the combine and draft day
Teams typically put draft prospects into categories based on measurable outcomes; for instance, a cornerback should have a sub-4.6 second 40-yard dash. Analytics and advancements in player tracking, however, tell us that the 40-yard dash is not as important as once thought. Instead, teams look into “game speed” (determined by tracking chips in player equipment) to know how effective a defensive back will be in coverage.
This makes a lot of sense because players will almost never run exactly 40 yards during a single play and definitely never without pads, so why should teams base valuable picks off of unlikely scenarios? Analytics make similar conclusions for defensive linemen by pointing out that a fast 10-yard burst is more important than the 40-yard dash time when determining effectiveness rushing the passer.
Speaking of the passer, with the quarterback being the most important position in the game (and likely all of sports), teams understandably dedicate a lot of time and effort to evaluating that position in the draft. Unfortunately, they still aren’t very good at it. The thinking is shifting however, away from stereotypical tall athletes with strong throwing arms and towards players who excel in a particular offensive scheme.
Analytics help teams evaluate college QBs by putting their stats into perspective based on the conference they play in. A QB in the SEC or Big 12 is likely to have more passing yards than someone in the Big Ten because of the different play styles in the conferences.
Completion Percentage Over Expected accounts for this by combining the difficulty of the throw itself (based on depth of target and other player positioning metrics) with the frequency that other players attempt and complete a similar throw. Teams then use this data to better understand how a draft prospect performs relative to his peers, which allows for players like Kyler Murray to break the mold on what’s expected from a top pick.
Only the Beginning
To be clear, draft day decisions go far beyond what’s covered here – some scouting departments break player tendencies all the way down to stride length when making these decisions. This is merely an introduction into how analytics help teams make personnel decisions.
What’s fascinating about football’s embrace of analytics is how the information will change the talent pool and how player evaluation will evolve alongside that. We’ve already seen some teams decide to reduce the number coaches going to the combine, choosing instead to review their own film and data. One thing’s for certain: organizations no longer rely on one avenue to provide all the information.


